

Towards an open, sustainable knowledge graph
Towards an open, sustainable knowledge graph
Blockchains are revolutionising data management and the Semantic Web


This story has its roots in the concept of Open Data. Though the term is ambiguous, it has come to embody the idea of data anyone can use, share, and build on, which serves many use cases.
Open Data aims to cultivate greater transparency, collaboration and innovation. This gave rise to the ambitious dream of the Semantic Web, which aims to weave connections between data everywhere to provide more structure and meaning.
The Semantic Web
The Semantic Web is a vision Tim Berners-Lee introduced in the 1990s. The idea is a future where data is easily accessible and understandable by both humans and machines. The concept was centred around a web of canonically linked data.
One of the key benefits of the Semantic Web is that it allows us to develop sophisticated applications without understanding the underlying data.
Such systems give us new opportunities for discovery and innovation, including enhanced artificial intelligence.

So what happened?
Despite all its touted benefits, the Semantic Web has struggled to get mainstream adoption, besides standalone use cases of organisations connecting their own data siloes that ideally shouldn’t have existed in the first place.
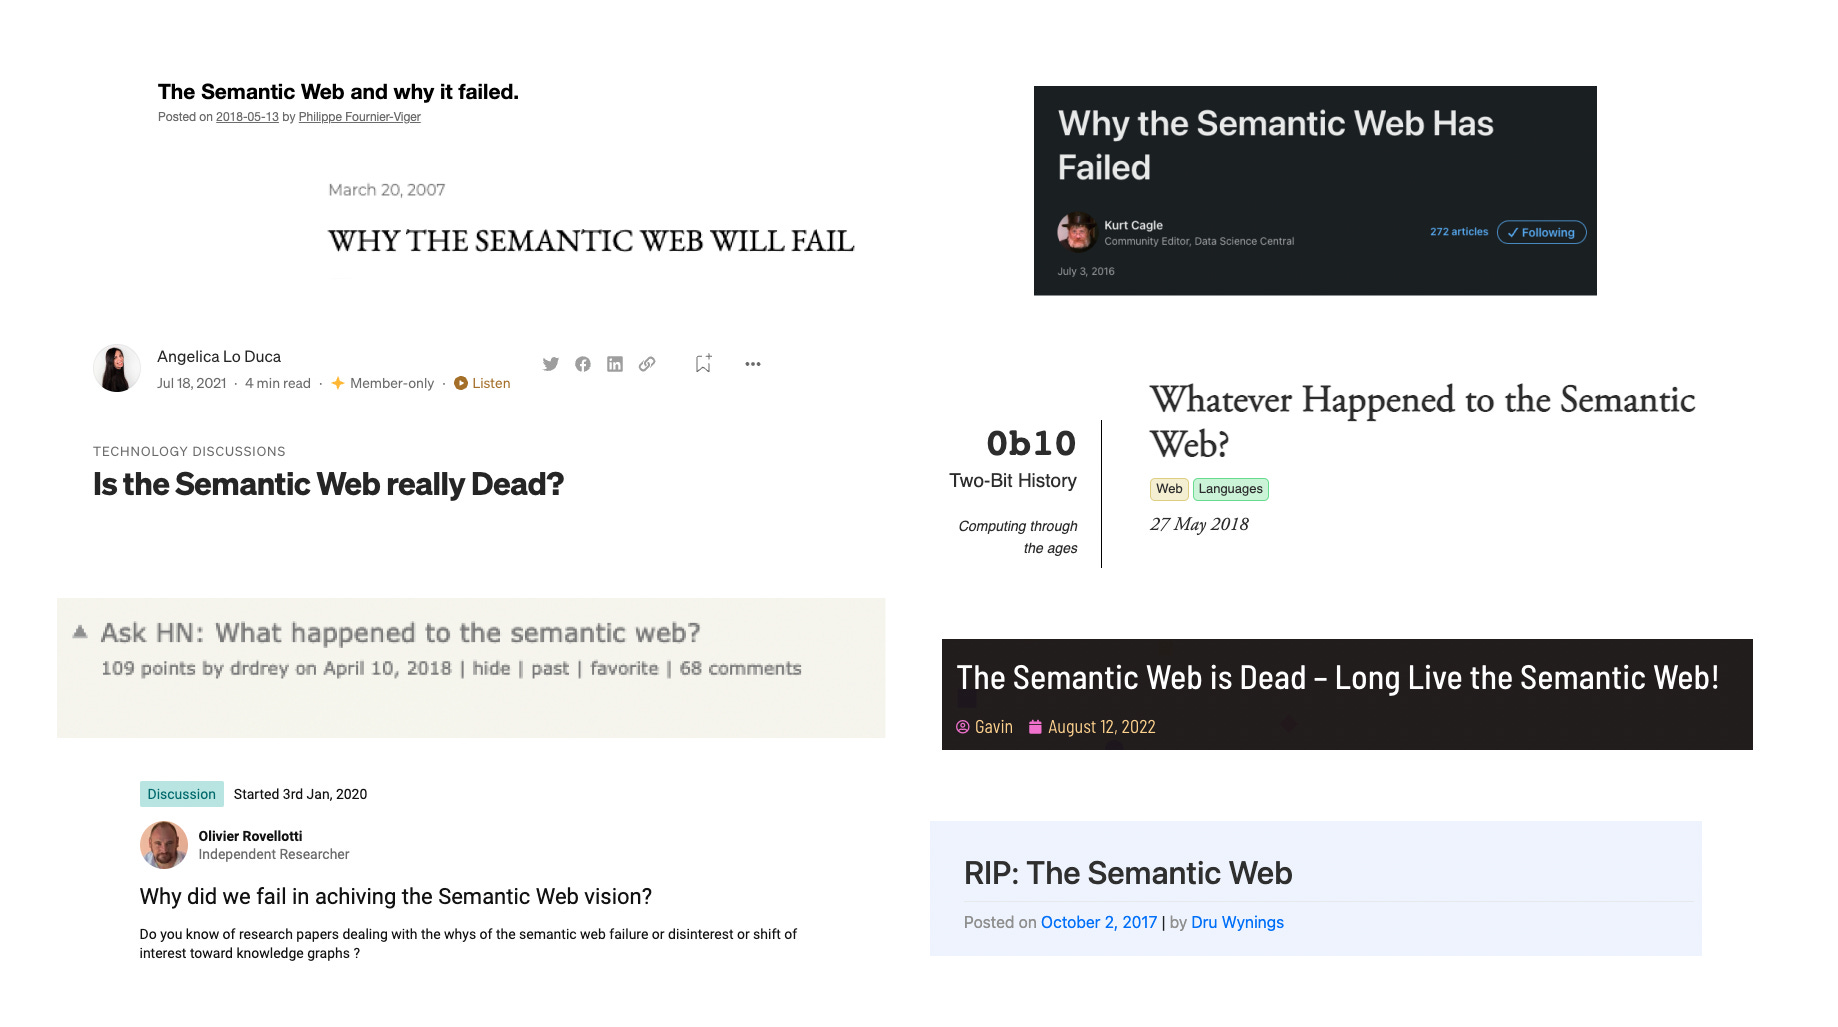
People often still debate the causes of this problem, usually mentioning the following:
(Lack of) incentives: Why would anyone invest in Semantic technologies with no clear ROI? And conversely, what’s to stop bad actors from providing misinformation?
Too complex: The Semantic Web requires a deep understanding of complex technologies, such as RDF and OWL, which most software developers either don’t know or don’t like.
Too fragmented: The Semantic Web is divided into different standards and technologies, making it difficult for developers to choose tools, create interoperable apps, and for users to find relevant information.
Requires migrations: The Semantic Web requires non-zero effort to integrate with existing systems and processes. It also prerequires a shift in mindset.
Data safety concerns: Some versions of the Semantic Web require sharing sensitive information, limiting its use cases.
Despite the challenges, the Semantic Web remains an exciting area of research and development that has the potential to transform how we think about and use data.
The most significant idea from the Semantic Web is arguably the knowledge graph.
Knowledge graphs
The improvement of the understanding is for two ends; first, for our own increase of knowledge; secondly, to enable us to deliver and make out that knowledge to others. - John Locke
In short, we can look at knowledge as a simple hierarchy.
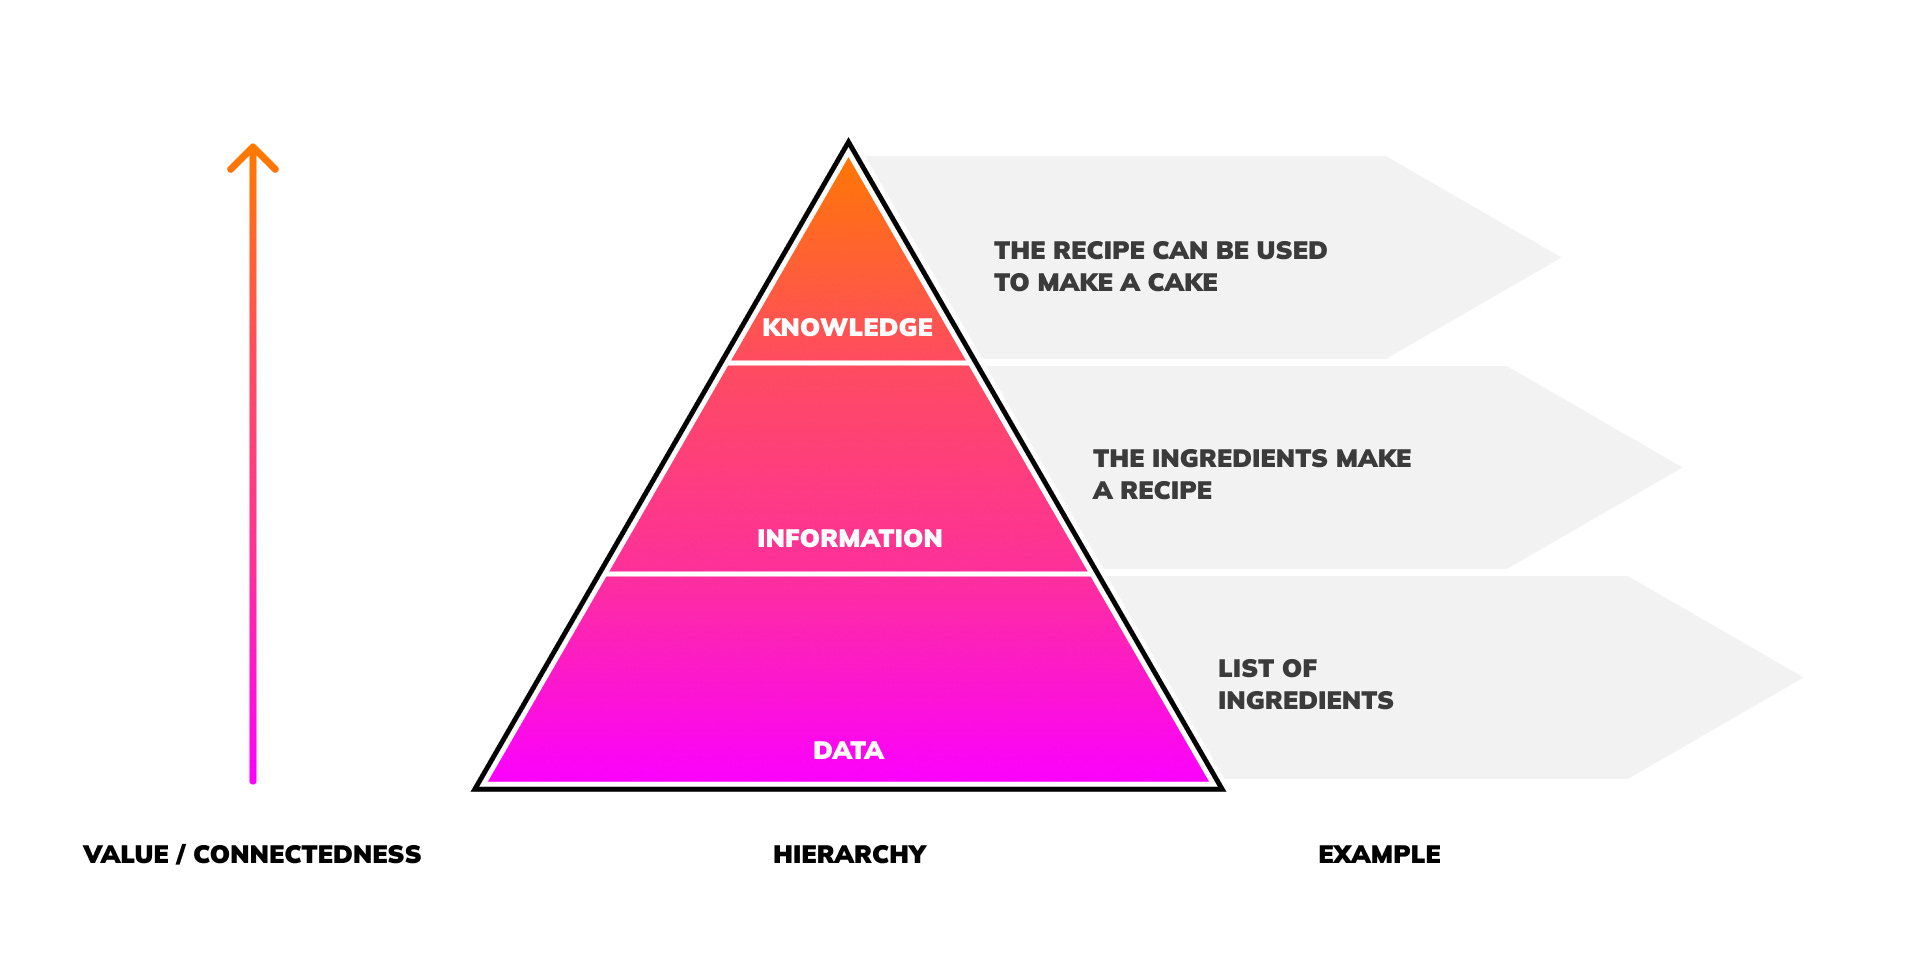
How it works:
Data: facts recorded as symbols
Information: data made meaningful
Knowledge: the result of understanding information
Connected data begets information. Connected information begets knowledge.
We can represent connections using graphs: intuitive data structures that describe relationships between things (entities). These entities are nodes (or vertices), and their relations are edges.
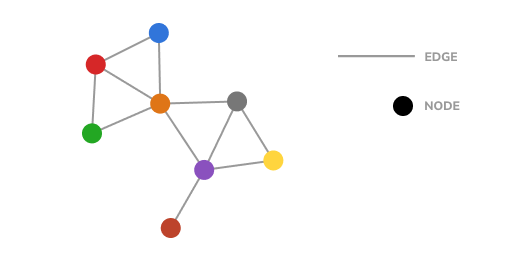
And so, a knowledge graph is a data structure that represents directed relationships between heterogeneous entities to give a complete understanding, or knowledge, of a particular subject.
![MATCH (a:Person {name:'Tom Hanks'})-[:ACTED_IN]->(m)<-[:ACTED_IN]-(coActors), (coActors)-[:ACTED_IN]->(m2)<-[:ACTED_IN]-(other:Person {name:'Tom Cruise'}) RETURN a, m, coActors, m2, other](https://substackcdn.com/image/fetch/f_auto,q_auto:good,fl_progressive:steep/https%3A%2F%2Fsubstack-post-media.s3.amazonaws.com%2Fpublic%2Fimages%2Fed24c417-00cd-409a-a37f-7dc81b024de4_1241x1133.png "MATCH (a:Person {name:'Tom Hanks'})-[:ACTED_IN]->(m)<-[:ACTED_IN]-(coActors), (coActors)-[:ACTED_IN]->(m2)<-[:ACTED_IN]-(other:Person {name:'Tom Cruise'}) RETURN a, m, coActors, m2, other")
You can easily read a semantic triple within a graph since it often follows the subject–verb–object (SVO) sentence structure, which is the norm in languages like English.

The result is that you can represent real-world knowledge in a graph more intuitively than you could with other data systems.
For example, here’s how the same data would look using rows and columns:

So, knowledge graphs are a powerful tool for organising and making sense of extensive data. As a result, various applications and domains, including search engines, e-commerce, and healthcare, have adopted them.
Perhaps the most well-understood knowledge graph is Wikipedia's Wikidata.
Wikidata — a general-purpose open knowledge graph
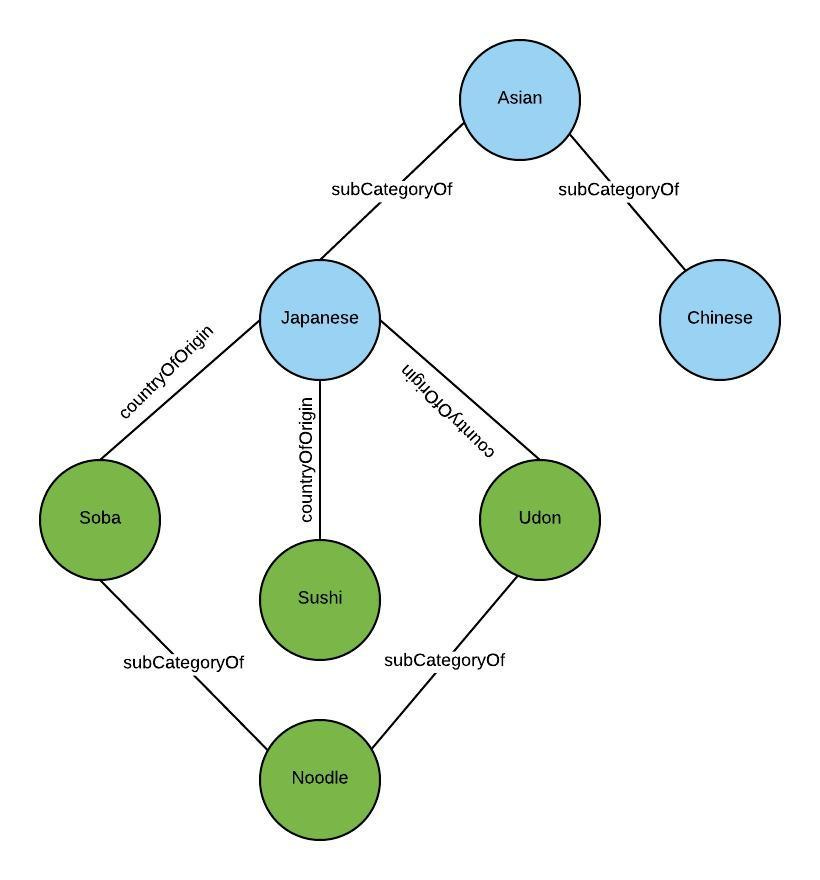
Wikidata connects data representing real-world entities and their relationships. It contains information from various sources, and their visualisations can convey concepts, broad categories, and connections between them.
For example, here’s the representation of a human and its related concepts traversing just the subclass of relations:

But knowledge graphs aren’t limited to just real physical things. For example, the hypothetical hybrid of a human and a chimpanzee is known as a humanzee (or chuman!).
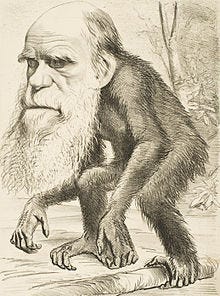
.jpg)
The Wikidata knowledge graph also represents this concept as a descendant of entity. We can traverse the “subclass of” relations for any concept with these edges, represented by the arrows in the (sub)graph below.
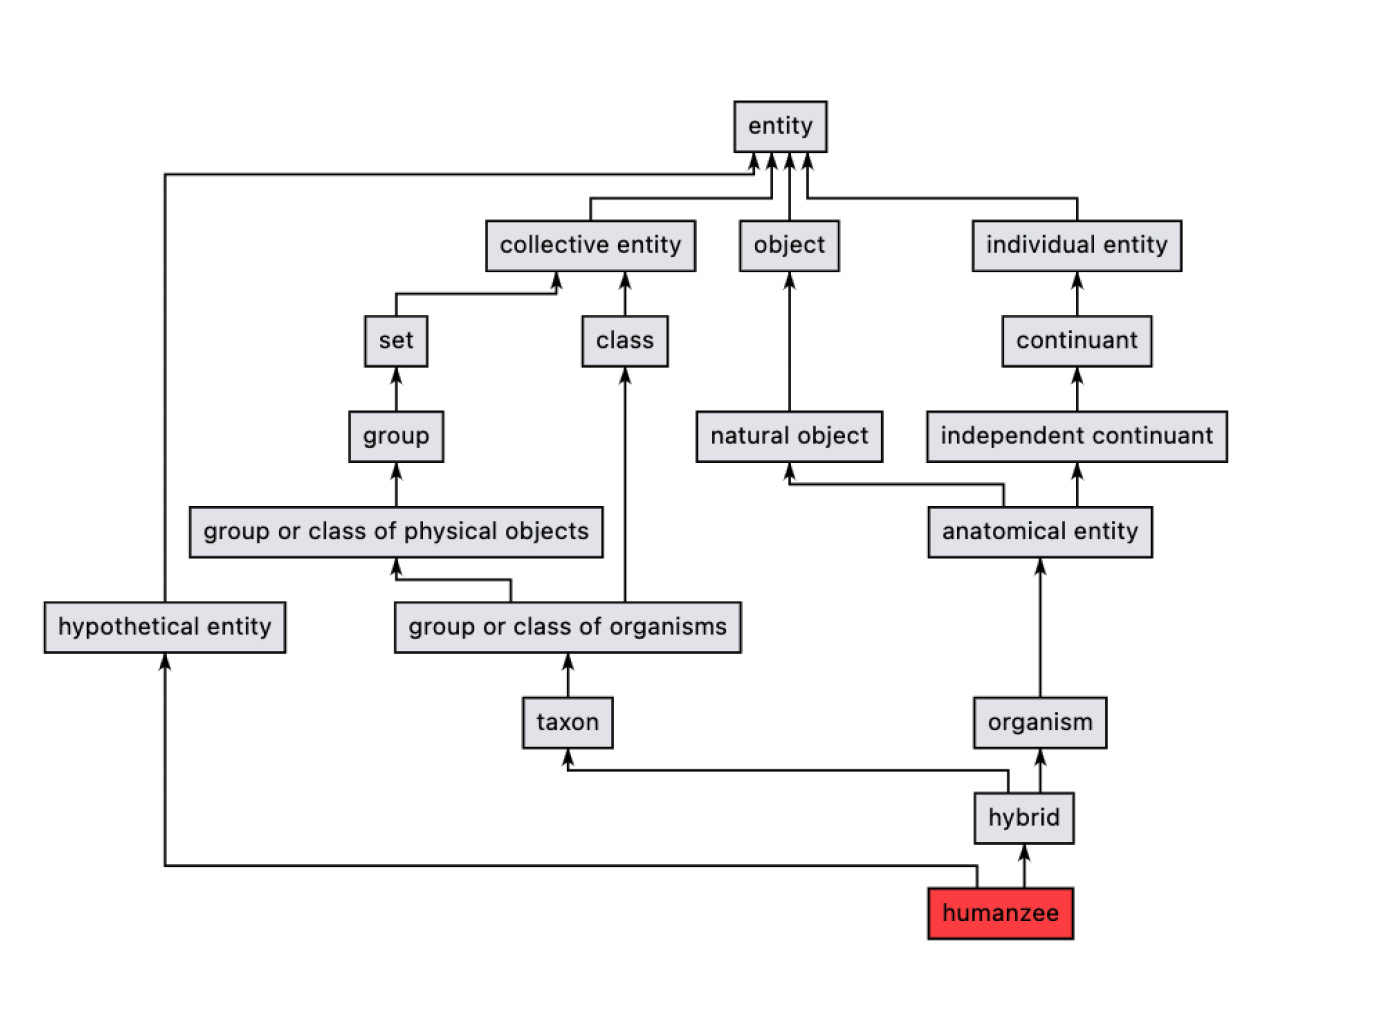
We can make simple inferences using this knowledge, such as deriving that humans aren’t hypothetical, humanzees are hybrids, both are organisms, and so on.
Your favourite big tech uses knowledge graphs
Uber's enterprise knowledge graph is extensive and a great example of a commercial knowledge graph.
For example, Uber Eats' food discovery knowledge graph stores information about different types of food, restaurants, ingredients, and user preferences. Relations between these nodes can include information such as the ingredients used in a particular dish, the restaurant's cuisine type, or the user's food preferences.
Uber Eats’ AI systems can make inferences about user food recommendations, such as suggesting dishes based on ingredient preferences, recommending restaurants based on cuisine type, or personalising the menu based on past orders.
The food discovery knowledge graph is critical in enabling Uber Eats to leverage its data to create a more intelligent and personalised user food discovery experience.
Additionally, their metadata graphs give them added benefits, such as differentiating between protected and non-protected data, helping them to comply with regulations like GDPR.
Big tech companies like Google, Amazon, and others also use knowledge graphs to better understand the warehouses of data they collect and generate. These uses ultimately feed into AI technologies, such as natural language processing, to provide more personalised experiences for users.
Google uses at least one knowledge graph to structure information about entities, including people, places, and things. Then, they use this understanding to enhance the search experience by adding context and related information about the entities.
Similarly, Amazon uses a knowledge graph to structure product information, including product descriptions, images, and prices, to improve product recommendations and provide more relevant search results.
Facebook does a similar thing with user relationships, interests, and activities, helping them improve user engagement and ultimately generate more revenue from ads.
These purposes can be generalised to fit into broader classifications.
Closed knowledge graphs have allowed large companies to reap massive competitive advantages. But, understandably, they lack the incentive to contribute such knowledge to a wider Semantic Web.
However, blockchains, which incentivise openness, enable a new knowledge graph.
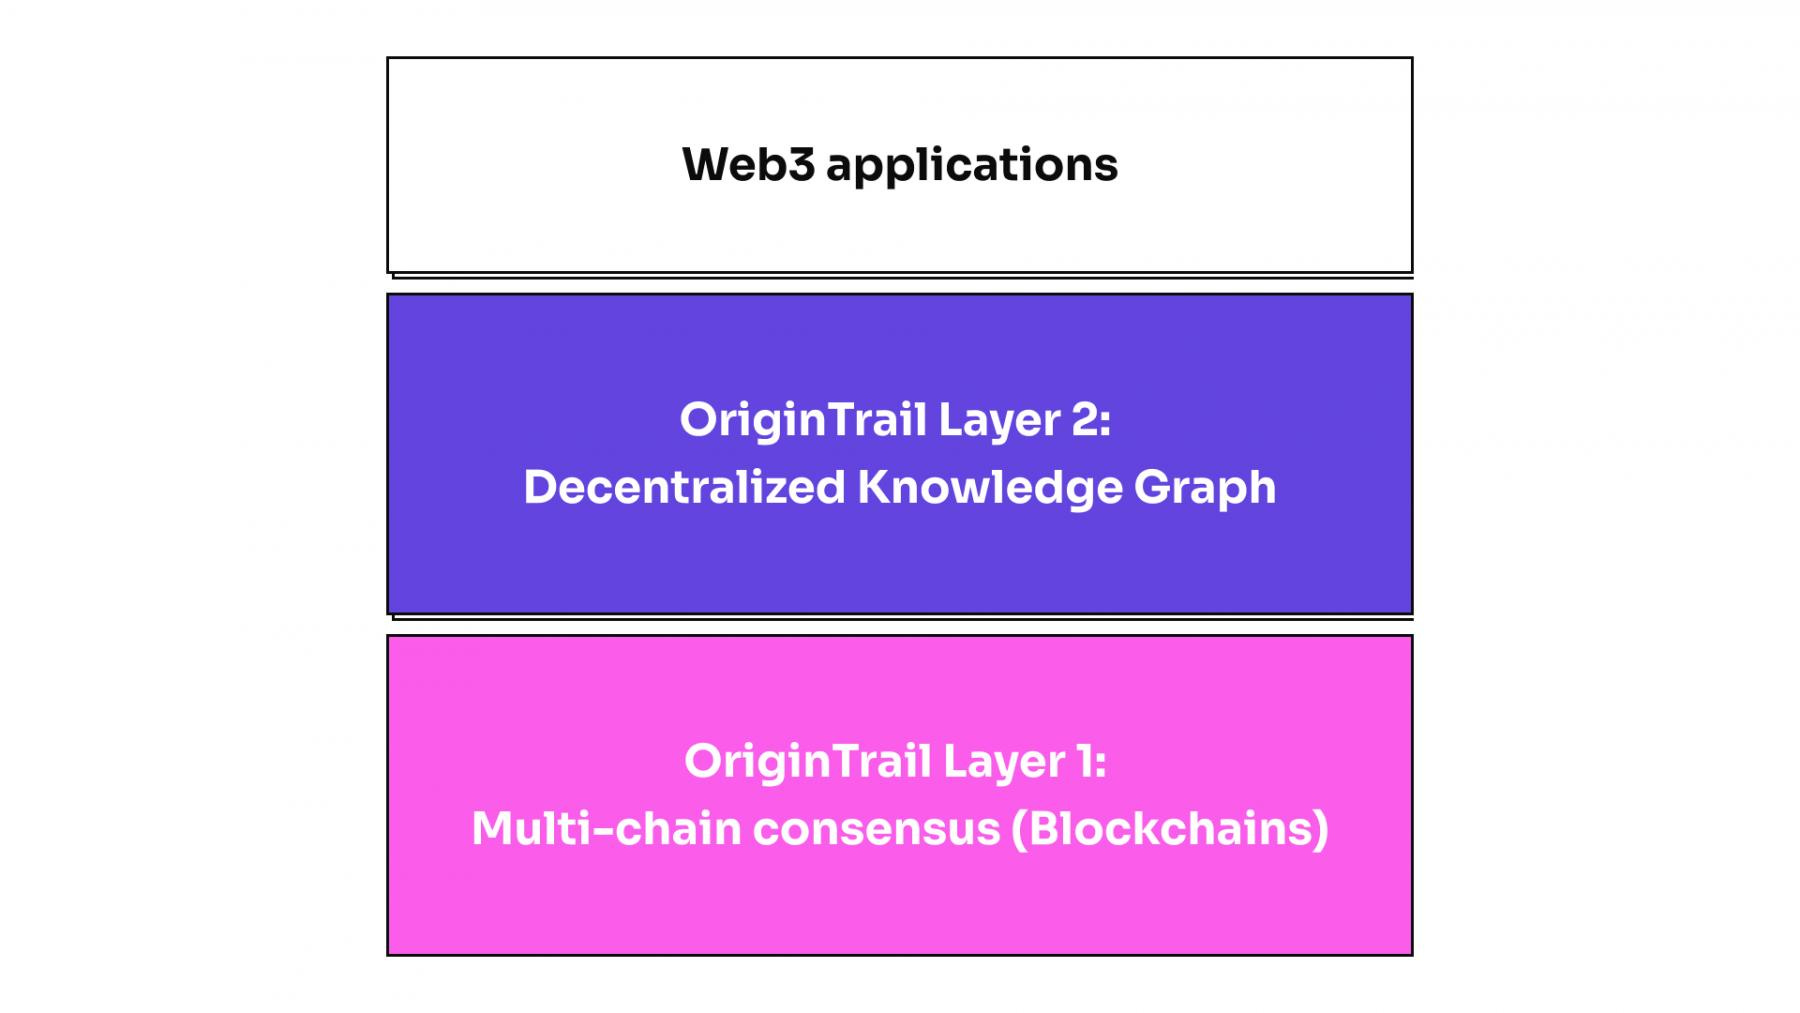
OriginTrail’s Decentralised Knowledge Graph
OriginTrail is a decentralised project built on blockchain technology, creating a transparent and trustworthy supply chain ecosystem with secure data sharing and analysis. It does this through its Decentralised Knowledge Graph (DKG).
Some of the noteworthy properties of the DKG include the following:
Decentralisation: Because a network of nodes stores all the data, rather than a centralised database, no single point of failure or controlling entity can compromise them.
Permissionless: Anyone can contribute or use assets stored in the DKG network.
Interoperability: The DKG is interoperable by design, making it easy for companies to share and exchange data.
Transparency: OriginTrail's knowledge graph makes data storage transparent, assuring stakeholders in a supply chain that information is trustworthy.
Security: The blockchain layer gives the DKG cryptographic resistance to data being altered or deleted, mitigating fraud and data breaches.
For these reasons, OriginTrail has grown significantly in recent years.
Utility
Graph size
The utility of OriginTrail's solution is closely tied to the size of its graph network, meaning that the more nodes and connections there are within the network, the more useful the data becomes.
OriginTrail uses Total Graph Size (TGS) to measure the network, where
TGS = |nodes| + |edges|
The current TGS is over 136 000 000 and growing.

An extensive network provides more opportunities for data exchange and collaboration between nodes. Based on Metcalfe's Law, which states that the value of a network is proportional to the square of the number of connected users, we can consider that the DKG could double in effectiveness in the next 15 months.
Metcalfe's Law is named after Bob Metcalfe (legend), the inventor of Ethernet and founder of 3Com. He has also been involved with OriginTrail, serving as an advisor to the project. With his background in networking and expertise in creating successful technology companies, Metcalfe's involvement in OriginTrail further validates the project's potential for growth and success.
The project continues to expand even further as it harnesses the network effects of being part of the Polkadot ecosystem, which works across multiple chains.
Data provenance and lineage
The OriginTrail Decentralised Network (ODN) offers interoperability to supply chains with decentralised governance. It does so by providing two important services:
Provenance: the origin of a product or item, from production and ownership to consumption. Recording provenance in a decentralised, immutable blockchain gives transparency and accountability to the supply chain process. Companies can use this information to identify potential risks and opportunities.
Data lineage: the history of data, including where it came from, how it was processed, and where someone stored it. This information is essential for understanding the quality and reliability of data and for regulatory and compliance purposes.
Compared to alternatives, OriginTrail's solution has several advantages, including its ability to integrate with existing supply chain systems, support for multiple data standards, and its decentralised, blockchain-based architecture, which ensures that data is secure and tamper-proof.
Importantly, OriginTrail's token economics also incentivises network participants to contribute and maintain data quality, enabling transparency and trust.
Tokenomics
OriginTrail has two tokens, TRAC and OTP, with fixed supplies of 500 million and 1 billion tokens. And according to their whitepaper, there has been no presale or predistribution of tokens.
TRAC is used as compensation for node runners who publish and update data. It can also be staked to improve asset ranking on data marketplaces and for reaping shares in rewards.
OTP facilitates transactions at the consensus layer and can be staked to vote on updates and increase earning chances.
Combining these tokens creates a system that incentivises growth in the OriginTrail ecosystem. This starkly contrasts with the Semantic Web, where lack of incentives was a major factor for its failure to gain adoption.
Case studies
OriginTrail lists many notable case studies demonstrating the DKG’s effectiveness in various industries.
For example, its work with the World Economic Forum helped to improve safety and efficiency in the supply of Personal Protective Equipment (PPE) during the pandemic. Their system verifies supplies and certifications of PPE products, helping to eliminate false claims and low-quality suppliers.
In another case study, OriginTrail worked with BSI on AidTrust, a project to improve the management of donations. The focus was on data interoperability, capturing and organising product data from various sources, inventory management and compliance, all to improve the efficiency of how, when, and where donations are collected.
The ODN is transparent, tamper-proof and global by design, which makes it easier for public health procurers to obtain quality supplies quickly. In addition, their partnerships lend to tracking welfare and sustainability across supply chains.
Comparing DKG with Wikidata
An open knowledge graph promises trust, diversity and democratisation.
But don’t we already have one of those?

As we’ve seen, Wikipedia’s knowledge graph, Wikidata, is also open and community-driven. It aims to store structured data about the world in a format that is easily accessible to machines and humans.
Wikidata is open-source and free to use, providing context for various concepts, but it has some caveats:
data quality depends on volunteers' contributions, which aren’t always accurate
it primarily focuses on general knowledge and may not include the more specialised or industry-specific information that some users need
it doesn’t support the type of data privacy and security features required for specific use cases
On the other hand, OriginTrail's knowledge graph is explicitly designed for use cases in supply chain management and other industries requiring high data safety, like medical data management. It also has extra features for data lineage and governance, making it easier to trace the origin of data and ensure its quality and accuracy.
This all results in OriginTrail's knowledge graph being a more secure, accurate, and specialised alternative to Wikipedia's knowledge graph.
Hybrid knowledge graphs in Solid pods
In another corner of the Metaverse, Tim Berners-Lee’s Solid project has steadily seen adoption as organisations use pods for novel applications that give users sovereignty over their data.
Currently, Solid apps can write data anywhere in a user’s pod, with the document being the smallest (atomic) organisational unit in a Pod. This raises the question of how applications can effectively share data.
To oversimplify the situation, a chat app may store and find my healthcare provider’s address as a property in, say, the people document of my pod:
https://storage.myserver.com/dexpod/contacts/people.ttl
Meanwhile, a prescription app refers to the same address in a different location, say:
https://storage.myserver.com/dexpod/healthly/prescriptions.ttl
The problem: Solid aims to eliminate these redundancies, the norm, for example, in enterprises with fragmented data siloes.
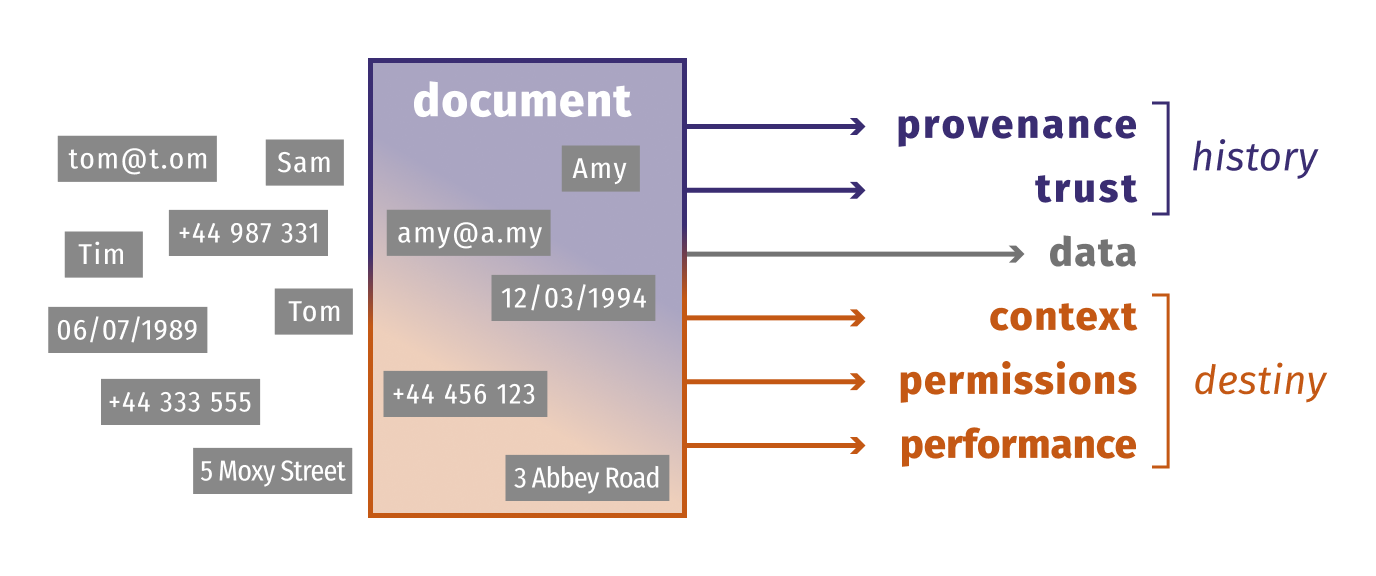
Recently, Ruben Verborgh, Solid Ecosystem Architect at Inrupt, wrote about this topic in greater detail and proposed a new conceptual model for pod data: a hybrid knowledge graph.
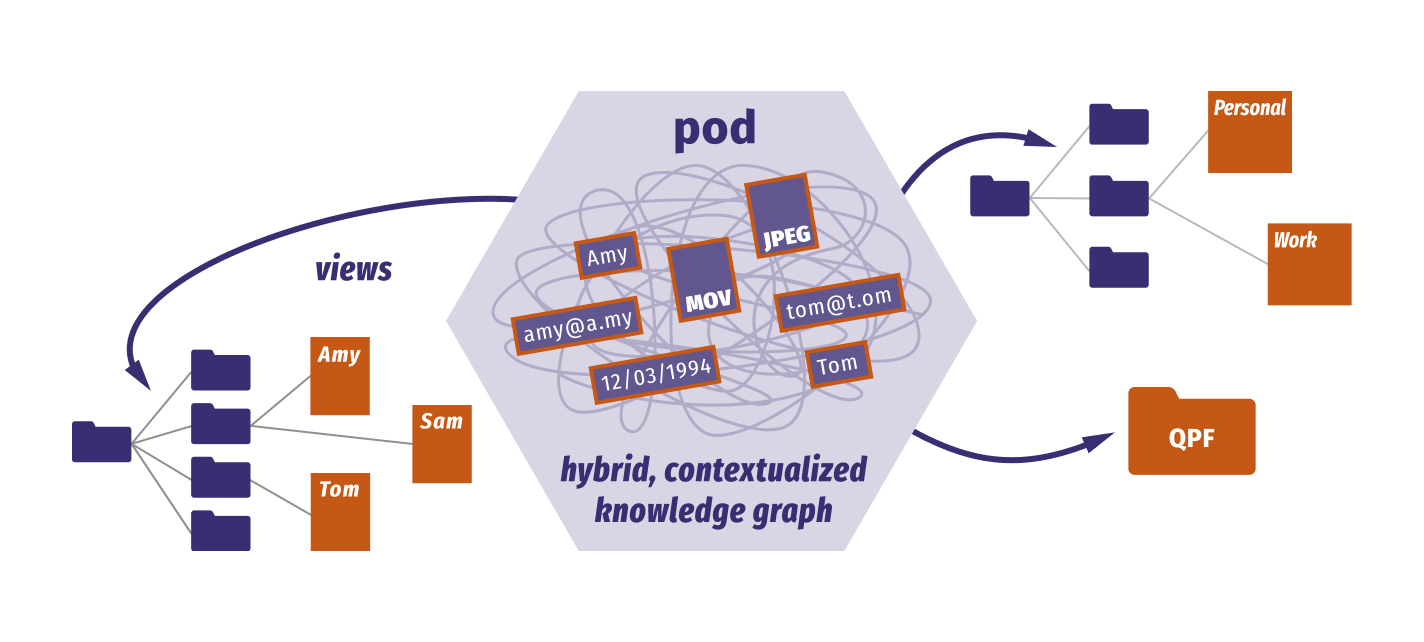
It’s too early to tell how this will play out, but this model allows us to think of each pod as its own knowledge graph. Open and secure, but it doesn’t seem fully interoperable.
Solid is a fascinating space to watch but seems less likely to deliver widely interconnected knowledge.
Final thoughts
The idea of an open, sustainable knowledge graph seems promising. From the seeds of Open Data to the Semantic Web and a thriving landscape of knowledge graphs, we've come a long way in our collective journey for structured, interconnected understanding.
Knowledge infrastructure is growing to be a vital part of our technology landscape. Gartner even predicts that graph technology will drive 80% of data and analytics innovations by 2025, up from just 10% in 2021! It feels far-fetched, but the pace of AI adoption is neck-breaking, making me hesitant to disagree.
Decentralised knowledge graphs suggest a sustainable way forward, offering economic incentives for participation and collaboration and creating a secure and trustworthy environment for a shared knowledge base. Blockchains are already purpose-built to track the provenance and lineage of the digital supply chain.
It seems we’re seeing the dawn of a new era, where the power of blockchains monetises and encourages open-source systems, and Web3 is reshaping Tim Berners-Lee's original vision of the Semantic Web, also formerly known as Web 3.0.
What do you think about knowledge graphs and their role in open data?
Quite interesting, how can I invest?
Nice write up.
"graph technology will drive 80% of data and analytics innovations by 2025, up from just 10%" wow!